Market Trends Made Simple: Uptrend, Downtrend & Sideways
Learn how to identify uptrends, downtrends, and sideways markets in seconds using the 10 EMA, 21 EMA Cloud, and 50 EMA. A simple visual method for understanding market direction.
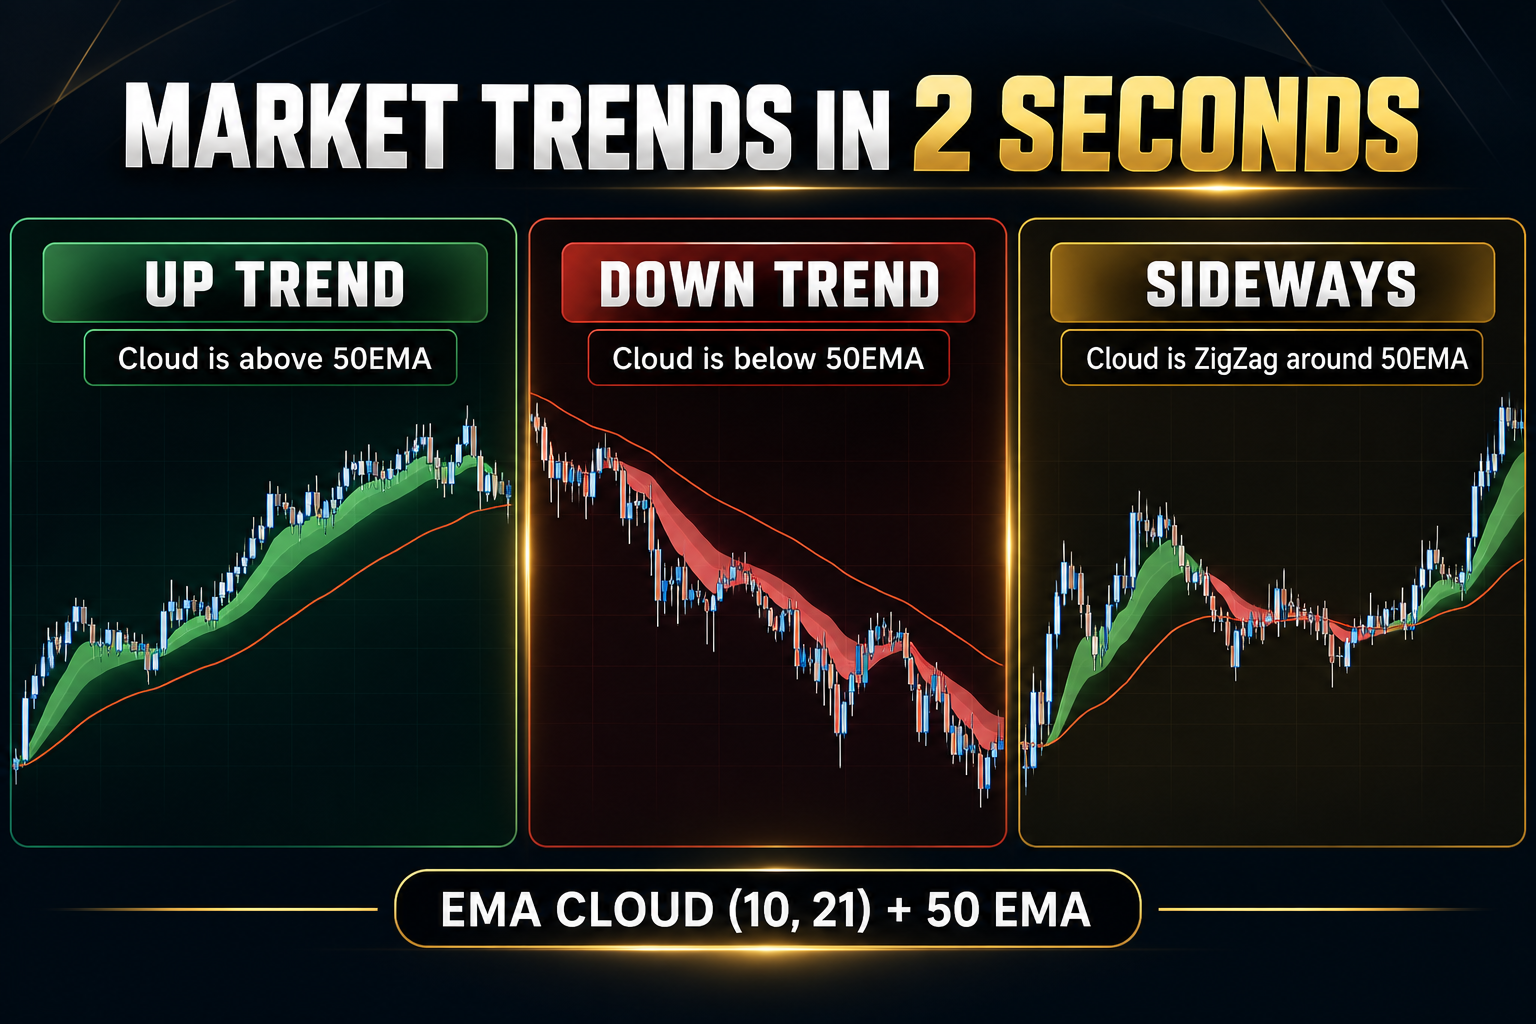
How to Identify Market Trends in Seconds
You don't need multiple indicators to understand the market's direction. Our simple method uses just two indicators: - EMA Cloud: 10 EMA and 21 EMA. - Trend Line: 50 EMA. By observing the position of the EMA Cloud relative to the 50 EMA, you can quickly classify the market into three conditions. That's it! one indicators. Three market conditions. Our system uses EMA: - EMA Cloud: 10 EMA and 21 EMA - Trend Filter: 50 EMA Identify the market using just three simple rules: 🟢 UPTREND: EMA Cloud is above the 50 EMA. 🔴 DOWNTREND: EMA Cloud is below the 50 EMA. 🟡 SIDEWAYS: EMA Cloud zigzags around the 50 EMA. Moving averages provide a general indication of market direction. They are not perfectly precise, but they help you understand the overall trend quickly. Three Rules to simply identify the Market Trend.
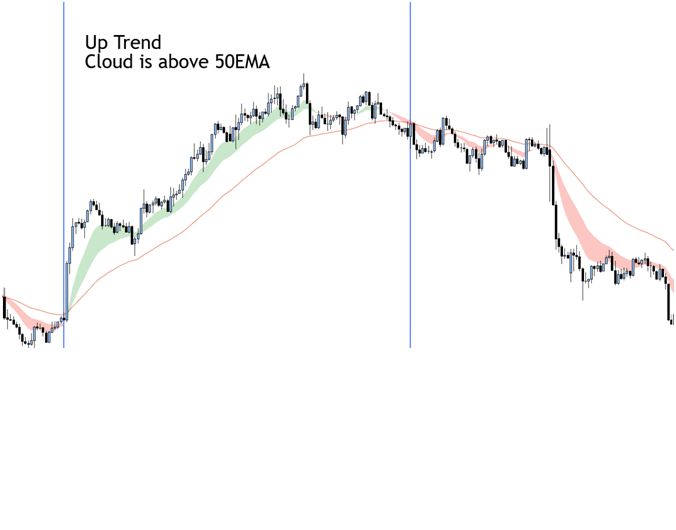
🟢 1. Uptrend — Buyers Are in Control
What does it mean? - The market is generally moving upward. - Buyers have the advantage. - Look for buying opportunities that match your trading setup. Remember: Cloud above the 50 EMA = Uptrend.
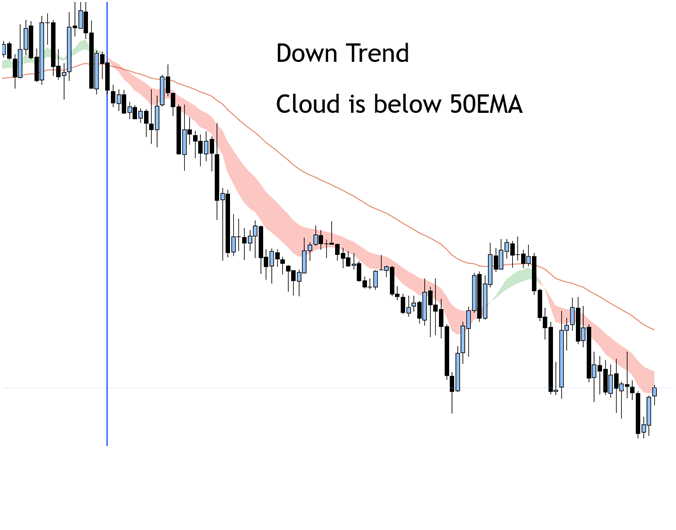
🔴 2. Downtrend — Sellers Are in Control
What does it mean? - The market is generally moving downward. - Sellers have the advantage. - Look for selling opportunities that match your trading setup. Remember: Cloud below the 50 EMA = Downtrend.
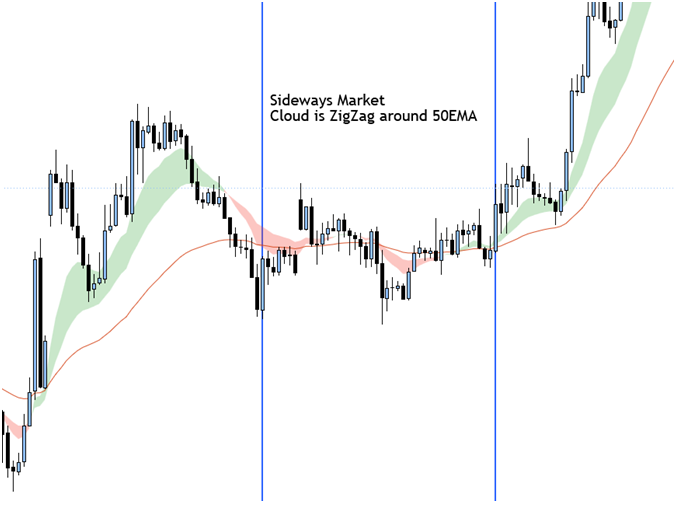
🟡 3. Sideways Market — No Clear Direction
What does it mean? - The market lacks a clear direction. - Buyers and sellers are competing. - Trend-following setups may be less reliable. Remember: Cloud zigzagging around the 50 EMA = Possible sideways market.
Why Use Moving Averages?
Moving averages smooth out price fluctuations and help us understand the market's general direction. The EMA Cloud shows short-term price momentum, while the 50 EMA provides a broader trend reference. Together, they offer a quick visual indication of whether the market is trending upward, trending downward, or moving sideways. One important point: Moving averages are not perfectly precise. They react to past prices and can lag behind sudden market movements. You can often classify the market at a glance, but the two-second rule is a quick assessment—not a guarantee of accuracy.
Remember This Simple Rule
The 2-Second Trend Rule 🟢 CLOUD ABOVE 50 EMA → UPTREND 🔴 CLOUD BELOW 50 EMA → DOWNTREND 🟡 CLOUD ZIGZAGGING AROUND 50 EMA → SIDEWAYS That's all you need to remember! Three conditions. One indicators. One simple approach